


 8 / 32

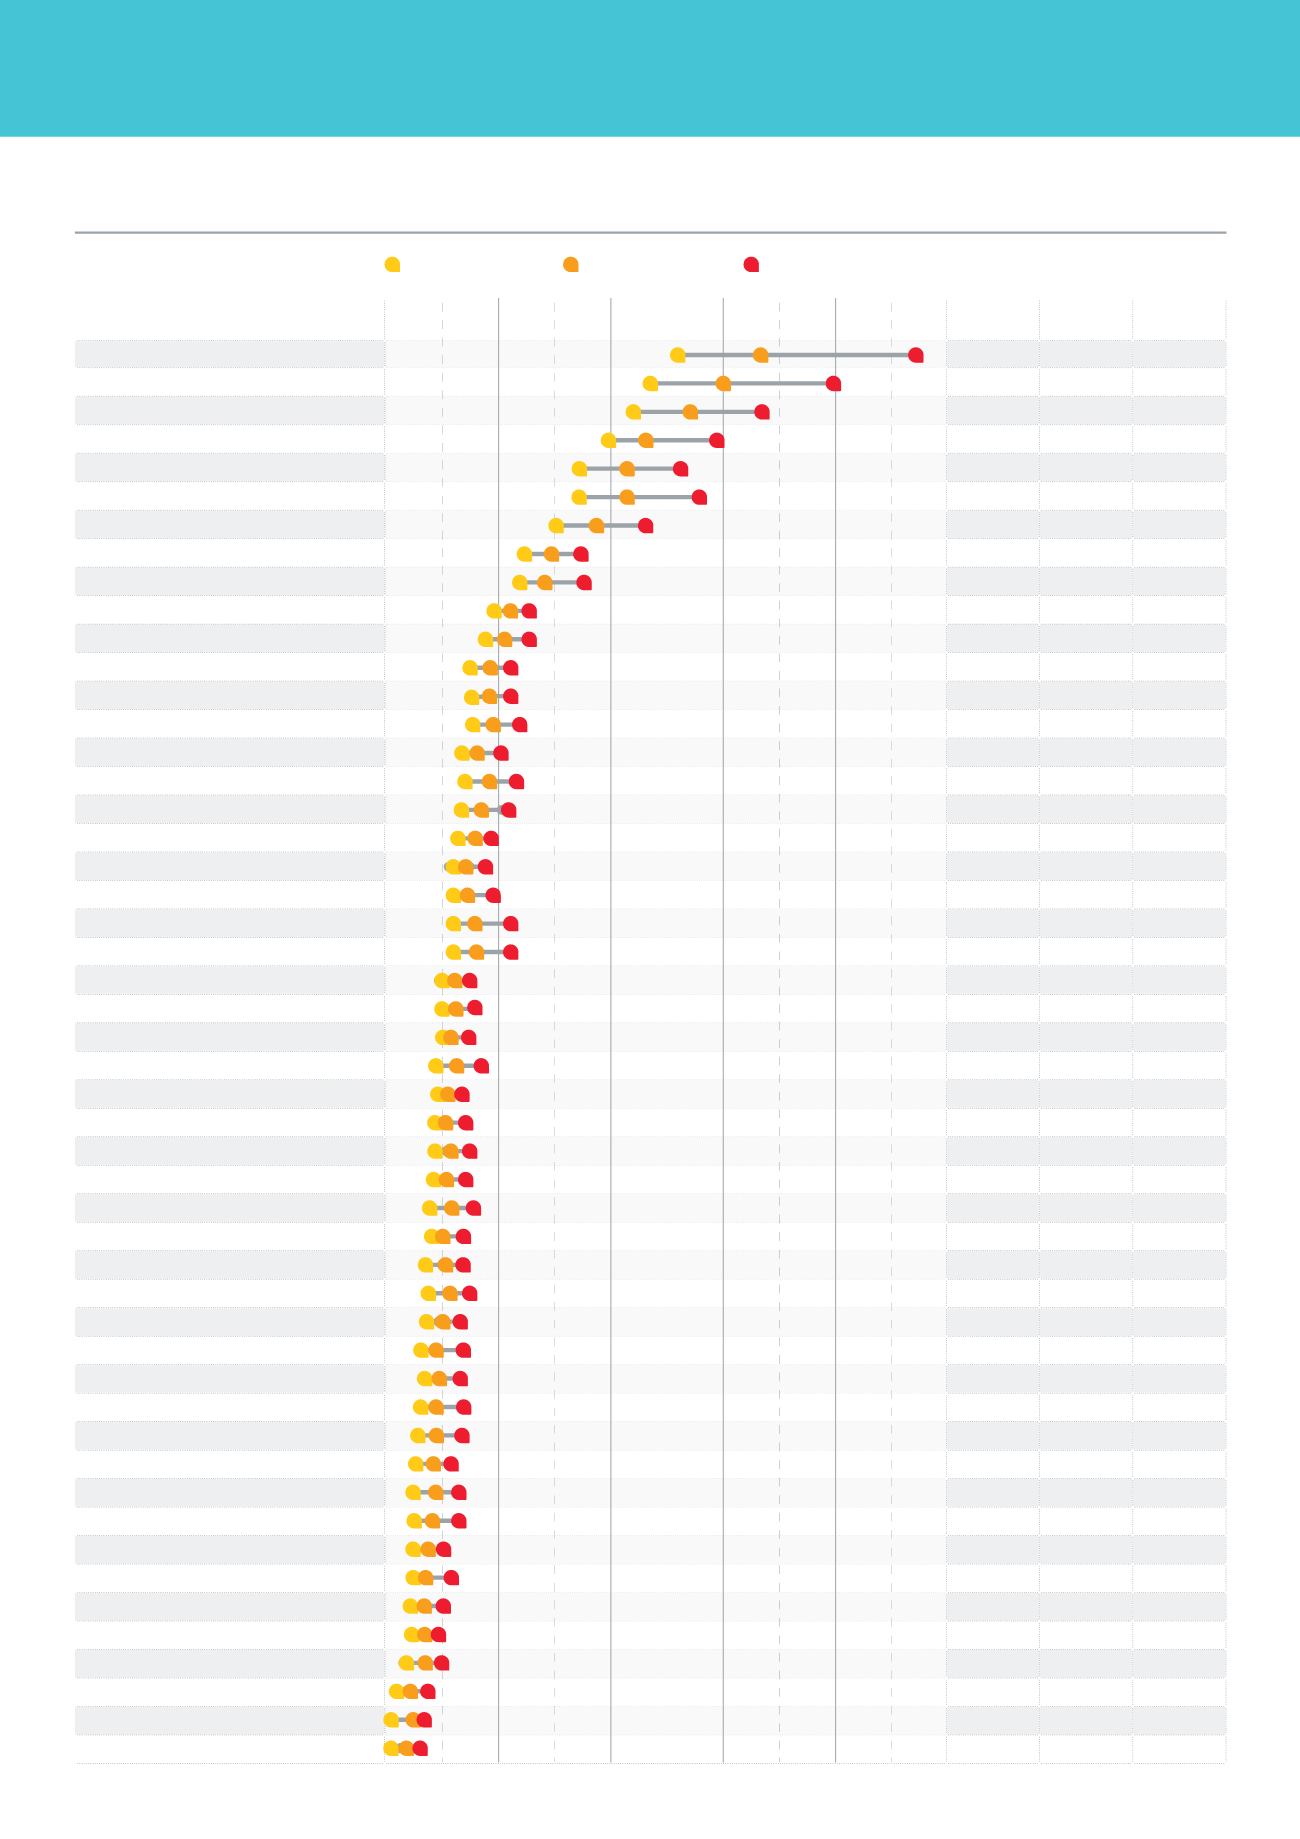
How Sydney and NSW regions compare
Number
sold
Days on
Market
12 month
growth
Eastern Suburbs
2,323
35
11.1%
Lower Northern Sydney
3,128
30
20.0%
Inner Western Sydney
1,453
35
21.8%
Northern Beaches
3,034
25
15.7%
Inner Sydney
2,647
28
20.0%
Central Northern Sydney
6,382
22
26.9%
St George-Sutherland
4,424
28
20.7%
Canterbury-Bankstown
3,570
30
18.8%
Central Western Sydney
3,657
24
22.3%
Fairfield-Liverpool
3,934
26
20.4%
Blacktown
4,726
13
20.0%
Outer South Western Sydney
5,546
14
20.6%
Outer Western Sydney
6,248
18
18.2%
Queanbeyan
655
82
-1.3%
Tweed Heads & Tweed Coast
1,075
70
6.0%
Wollongong
4,266
28
13.2%
Central Coast
7,546
23
14.4%
Port Macquarie
916
39
5.7%
Coffs Harbour
795
66
3.2%
Newcastle
10,172
49
4.7%
Illawarra SD Bal
3,630
68
10.7%
Richmond-Tweed SD Bal
2,354
84
5.5%
Nowra-Bomaderry
835
49
9.7%
Lower South Coast
1,710
106
2.0%
Bathurst
678
70
2.9%
Hunter SD Bal
1,720
111
3.9%
Lismore
518
81
5.0%
Orange
735
95
-1.9%
Clarence (excl. Coffs Harbour)
2,062
98
2.9%
Dubbo
802
44
6.6%
Hastings (excl. Port Macquarie)
2,394
90
7.6%
Wagga Wagga
1,081
76
0.7%
Tamworth
847
79
5.9%
Southern Tablelands (excl. Queanbeyan)
1,595
80
4.8%
Albury
974
75
6.9%
Central Tablelands (excl. Bathurst & Orange)
1,071
95
1.9%
Northern Tablelands
1,139
101
10.4%
Snowy
351
123
7.3%
Northern Slopes (excl. Tamworth)
707
97
7.2%
Lower Murrumbidgee
639
91
8.9%
North Central Plain
349
115
8.0%
Central Macquarie (excl. Dubbo)
874
98
-7.1%
Upper Murray (excl. Albury)
398
125
2.8%
Central Murray
558
103
-0.4%
Central Murrumbidgee (excl. Wagga Wagga)
921
112
0.5%
Lachlan
995
99
8.1%
Murray-Darling
142
76
-8.1%
Macquarie-Barwon
198
97
14.5%
Upper Darling
75
138
-19.7%
Far West
349
128
-2.7%
NEW SOUTH WALES
$0.5m
$1.5m
$2.0m
$2.5m
$3.0m
Lower range (25th percentile) Median price (50th percentile) Upper range (75th percentile)
6