


 10 / 32

Melbourne’s housing market has benefitted from strong economic
conditions that are sheltered from the downturn in the mining sector.
Population growth remains strong across Victoria and Melbourne,
driven by high rates of interstate and overseas migration which is
supporting housing demand. The capital gain performance has been
much higher for houses compared with units over recent years,
which likely reflects the higher supply levels keeping a cap on the
overall pace of capital gain within the apartment sector. More recently,
housing market conditions have shown some signs of moderating;
however, values broadly continue to rise at a slower pace than earlier
in the year.
VICTORIA
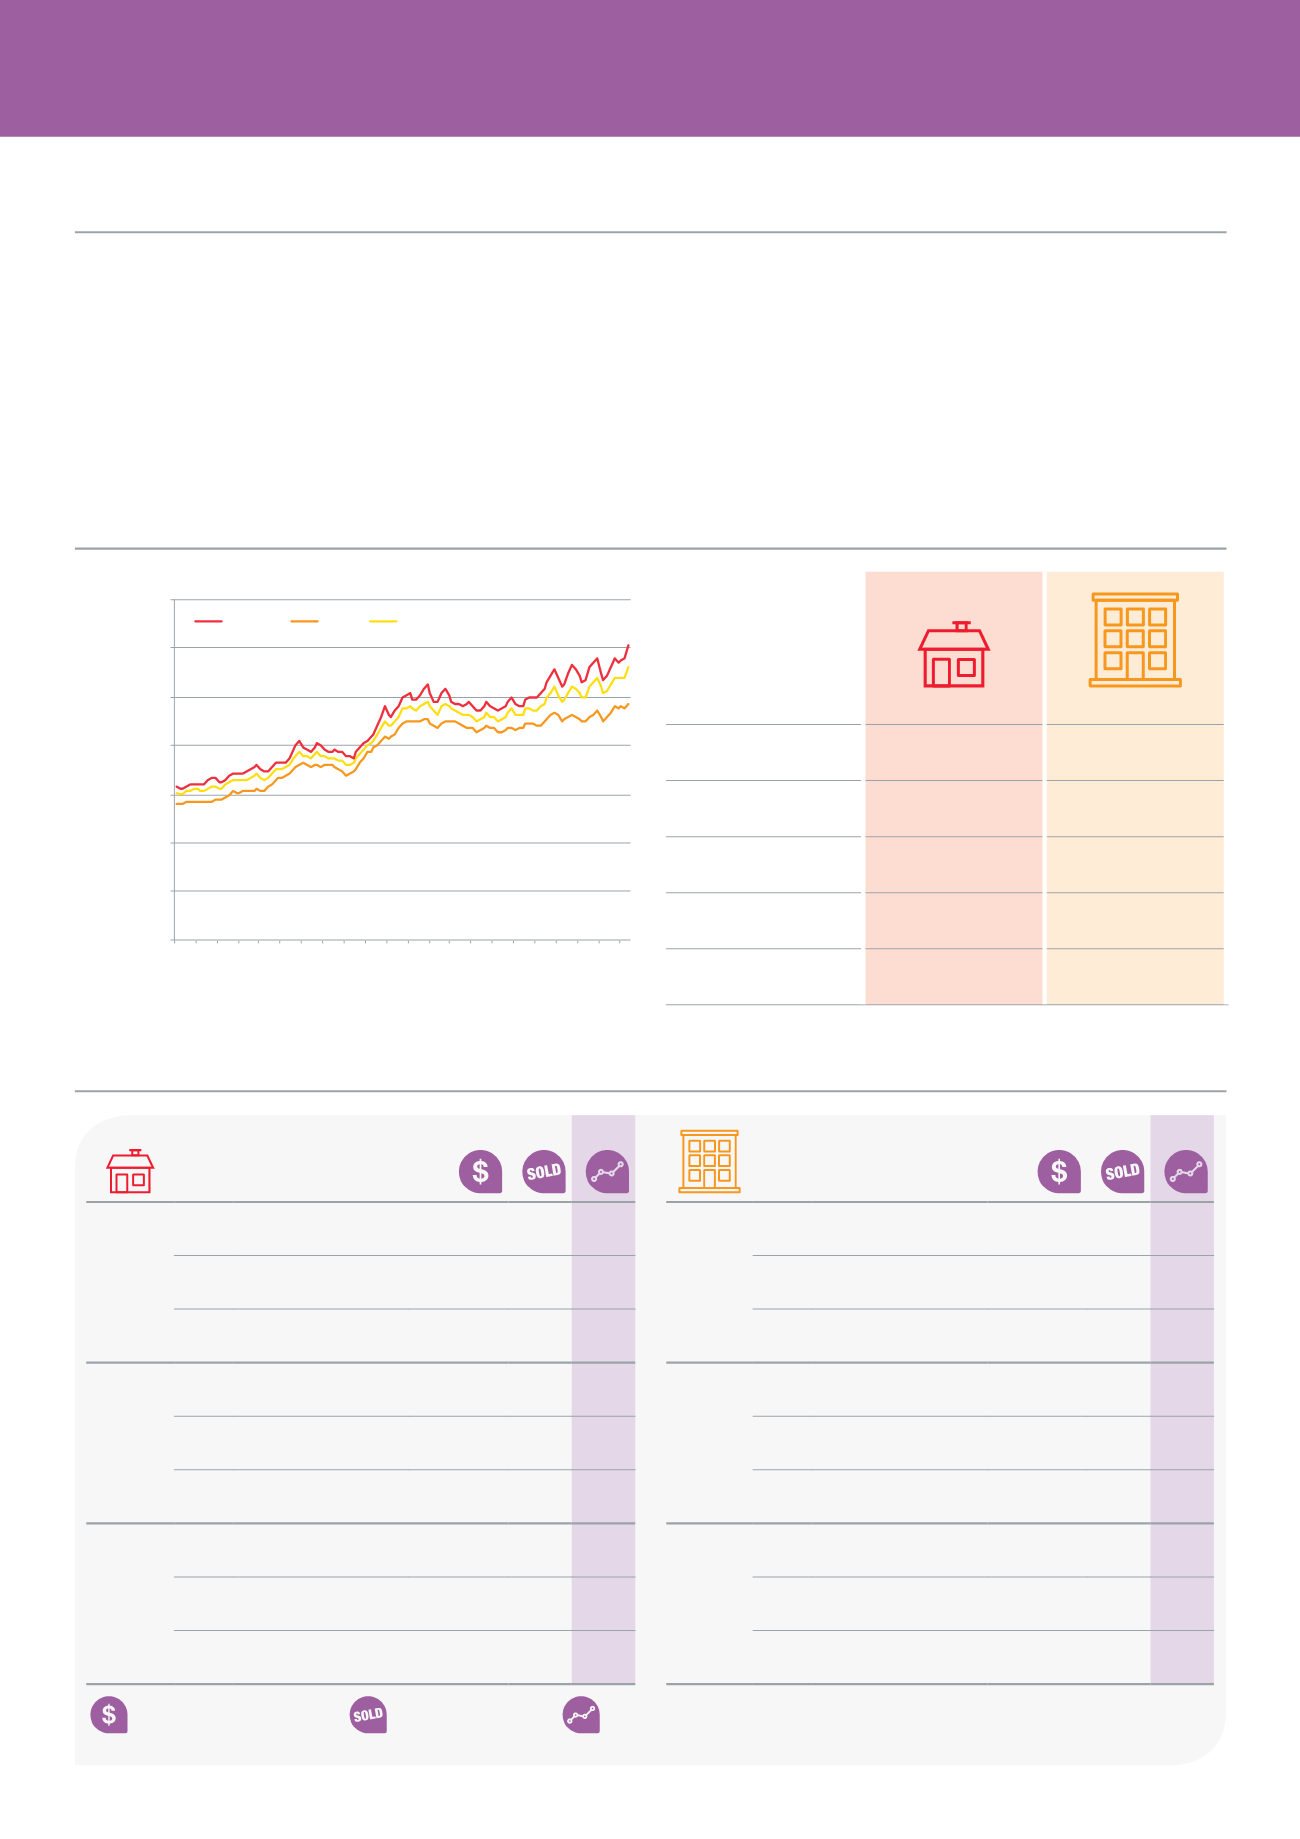
Migration drives Melbourne’s growth
Melbourne’s performance over time
Melbourne’s best performers
Melbourne Median Price
Houses
Units
Dwellings
$0
$100,000
$200,000
$300,000
$400,000
$500,000
$600,000
$700,000
JAN-05
JUL-05
JAN-06
JUL-06
JAN-07
JUL-07
JAN-08
JUL-08
JAN-09
JUL-09
JAN-10
JUL-10
JAN-11
JUL-11
JAN-12
JUL-12
JAN-13
JUL-13
JAN-14
JUL-14
JAN-15
JUL-15
Houses
Units
Median Price
$605,000
$485,000
Quarterly change
7.8%
3.9%
12 months change
15.5%
3.7%
5 year total change
23.6%
8.1%
10 year total change
103.7%
67.8%
Rank
Suburb
$
Affordable
1
FRANKSTON NORTH
$285,000
143 8.8%
2
DOVETON
$330,000
186 6.5%
3
MILLGROVE
$268,000
39 5.1%
$$
Mid range
1
YARRA GLEN
$500,000
40 14.9%
2
WILLIAMS LANDING
$496,000
105 14.7%
3
HADFIELD
$515,000
111 12.9%
$$$
Prestige
1
MIDDLE PARK
$2,243,750
64 34.4%
2
MONT ALBERT
$1,821,000
59 29.5%
3
CANTERBURY
$2,374,000
127 23.2%
Rank
Suburb
$
Affordable
1
WYNDHAM VALE
$276,000
26 10.4%
2
WERRIBEE
$265,500
147 6.2%
3
HOPPERS CROSSING $271,500
39 4.0%
$$
Mid range
1
RYE
$405,000
17 22.7%
2
POINT COOK
$370,000
43 22.3%
3
FLEMINGTON
$398,750
61 15.5%
$$$
Prestige
1
BALWYN
$785,500
126 27.0%
2
TOORAK
$935,000
218 20.5%
3
MCKINNON
$780,000
39 14.5%
Rolling Median Price (12 months)
Number sold (12 months)
12 month change in median price
Affordable
= suburbs below 25th percentile
Mid range
= suburbs between 25th and 75th percentile
Prestige
= suburbs above 75th percentile
8